Bio-logging and camera trapping services
Biotelemetry and biologging are commonly applied methods to investigate the ecology and movement behaviour of aquatic species in relation to their environment. They provide a scientific basis for management and conservation and has significantly improved our understanding of ecosystem functioning and dynamics. More specifically, telemetry provides valuable data that can be used in many policies and directives.
European Tracking Network
To do so, ETN strives towards a integrated pan-European biotelemetry network linked to other initiatives in a global context. Therefore, a virtual research environment (VRE) is available to the European animal tracking community. The VRE has a data management portal and a number of analytical tools for analysing the data. The data management portal gives access to all types of fish telemetry data (currently acoustic telemetry, C-POD, acoustic archival and archival data is supported) and provides an interface to manage, download, explore, and share telemetry data. The analyltical tools include an RShiny GUI for data exploration, an RStudio IDE to develop and run R scirpts online and an Rpackage that provides specific functions to start a smooth data-analysis.
Online tutorials and step-by-step instructions are available.
Agouti
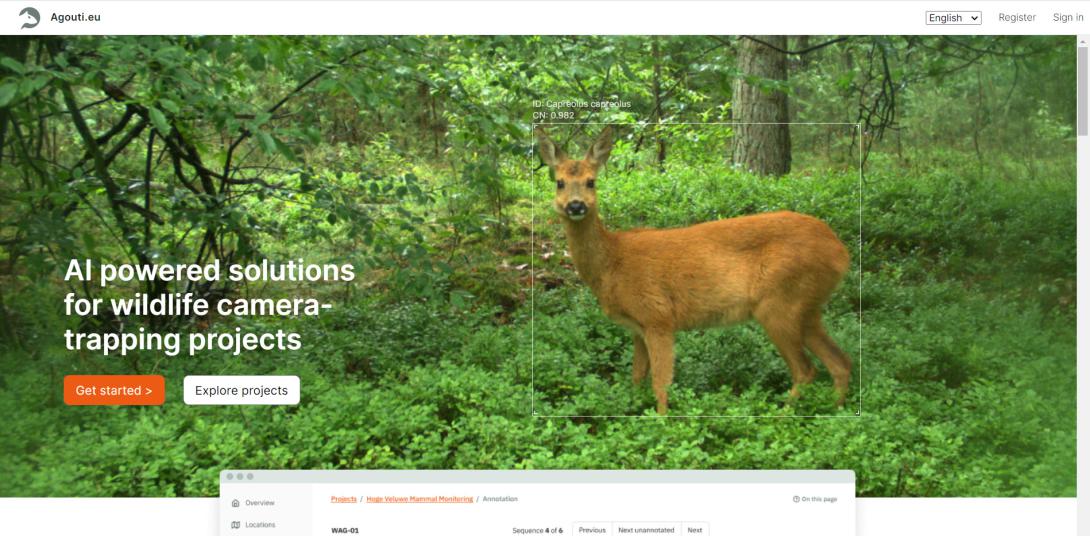
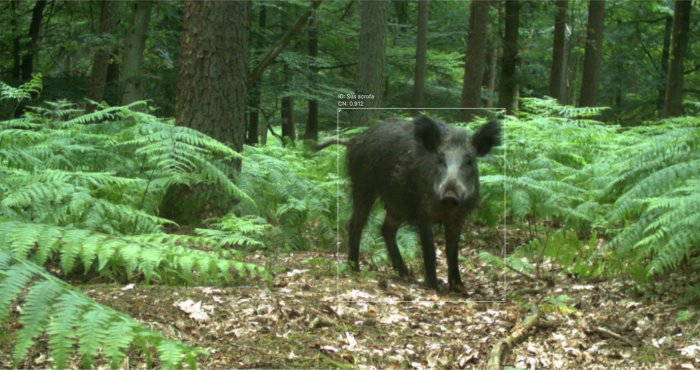
Agouti.eu is an online platform for the efficient management of camera trap data. It accommodates researchers, wildlife conservationists, citizen scientists and ecological studies by providing a comprehensive solution for handling large amounts of wildlife imagery. With agouti.eu, users can easily upload and store images, organize surveys, efficiently process images, obtain standardized results output, and safely archive your data.
Agouti follows the Camera Trap Data Package (camtrap DP) standard, a community-developed data exchange format for camera trap data. The R package camtraptor was developed to read, explore and visualize camtrap DPs. With camtraptor, you can read and filter data, create overviews of observed species, relative abundance or effort, and plot these data on a map.


